Six Measurable Signals Of Product Market Fit
Some might say they feel it through intuition. Others measure instead.
Product market fit (PMF) is potentially the most important concept for early stage companies and startup, and is a first milestone towards a scalable and sustainable business.
While there’s no single definition, some startup leaders have offered their definitions below:
Lenny Rachitsky, from Lenny’s Newsletter focuses his definition on desirability, sustainability and profitability:
“[PMF is when] you’ve made a product people want, can find and keep people sustainably, and makes a profit delivering to people at scale”
Marc Andreessen, Silicon Valley entrepreneur, co-founder of the VC firm Andreessen Horowitz, focuses his definition on market satisfaction:
“Being a good market with a product that can satisfy that market” and when building startups “it’s the only thing that matters”
Reid Hoffman, focusses on the sustainability of differentiations, per his book Blitzscaling: The Lightning-Fast Path to Building Massively Valuable Companies, that:
“… the key product/ market fit question you need to answer is whether you have discovered a nonobvious market opportunity where you have a unique advantage or approach, and one that competing players won’t see until you’ve had a chance to build a healthy lead.”
Perhaps the most visual definition has been offered by Dan Olsen, summarised in his talk at the PRODUCTIZED conference in 2017. A summary of his talk can be found on his guest post on Medium.
Dan breaks down the components of the PMF into two sections: The Product vs. The Market. Our jobs as PMs is to close the gap by understanding the market whilst tailoring a delightful MVP to address underserved needs.

“The bottom layers of the pyramid is the market (Target Customer + Customer’s Underserved Needs). As a PM, you should remember that you don’t control the market. If you change your customer, then your whole pyramid falls down and you have to start all over again.”
The top layers are where the product […] comes in… you have more control and that is where you form hypothesis and execute them. This layer is broken up into three key elements: Value Proposition, Feature Set, UX Design.
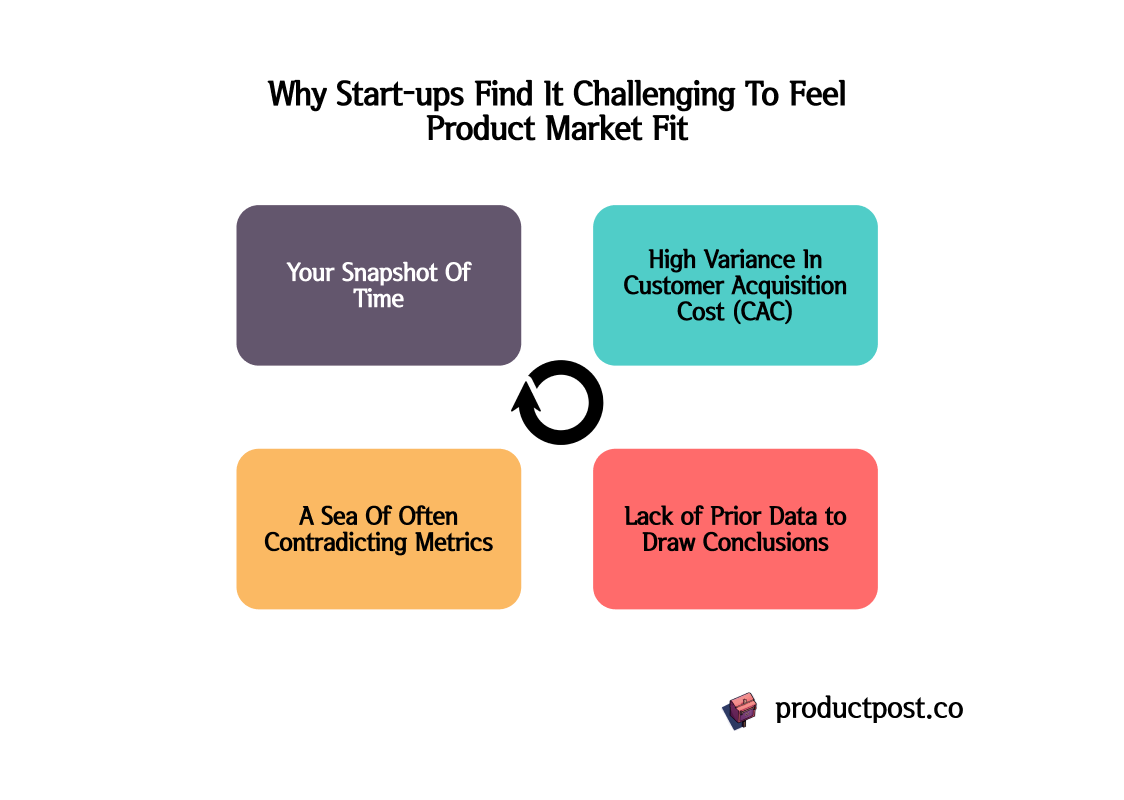
For many PMs, these definitions may make sense immediately upon hearing them. However, finding a definitive way to measure it may be challenging for a number of reasons, varying depending on your company industry, life stage and customer type, to name a few.
Let’s take a look at some common challenges below.
Challenges In Measuring Product Market Fit
Your Snapshot Of Time
At any given moment, your product may seem to fit well with your target market, but can change rapidly , especially due to shifts in consumer trends, competition or drastic or large industry or regulatory changes.
Consider a product such as Threads, launched by Meta (Instagram), at a time when users of Twitter, their main competitor, were starting to lose faith due to recent changes in the product and leadership.

In the initial 5 days of launching, they acquired a staggering 100 million users, suggesting a strong market fit from the outset. However, user engagement has since plummeted, according to Similarweb. A 20% drop in daily active users and a 50% decline in time spent on the app one week post-launch.
Ongoing assessment is crucial as market conditions, competitor offerings, and consumer needs evolve. Related to this challenge, is the fact that many products have hundreds of metrics that may send mixed messages, bringing us to our next challenge… 👇
A Sea Of Often Contradicting Metrics
Determining product-market fit involves analyzing various metrics such as customer satisfaction, retention rates, churn rates, revenue growth, and customer feedback. On top of this, there are profitability metrics related to costs-to-serve, operating costs, gross and net margin as well. However, no single metric can provide a comprehensive understanding of PMF.
While many metrics can provide indications to overall fit, different metrics may contradict each other, making it difficult to draw definitive conclusions. Similarly, unseasoned product managers may focus on the wrong (“vanity”) metrics that may appear to be a success, but ultimately does not measure the right metric.
For example, say you’ve launched a mobile app that sells digital gift cards to your customers. Think Apple, Steam, Microsoft, Facebook credits that can be used as digital currency within App Stores. You then see the following patterns across 12 months:
✅ 4,000,000 app installs
✅ 30,000 weekly active users by end of year (grew from 15,000 to 30,000 across 12 months)
✅ 30% of revenue coming from buyers of 10+ cards per month
✅ $40.5m transaction value, growing from $300,000 the year before
Seems like a successful venture, right? What if I also told you that related data showed the following:
🛑 Fraud losses as a % of all payment value = 15%
🤔 Gross margin of 10%
🛑 Net margin of -5%
Based on the above, you see strong customer demand in downloads, and weekly active users too, and strong engagement. However those non-fraudulent customers aren’t buying from you enough to counteract the fraud losses seen on your product.
In this case, many would say that you haven’t really reached Product Market Fit. Choosing a right balance of metrics is key. We delve deeper into this later in this post.
Lack of Prior Data to Draw Conclusions
A common problem for all new products or startups, is the limited historical data set to benchmark against. Without a baseline, it's challenging to assess whether the current level of customer adoption and satisfaction signifies a strong product-market fit.
Lack of historical data makes it harder to interpret current performance accurately without context. In many cases, PMs need to wait to build up data before they perform deeper analysis across more time, products / SKUs and customer segments to understand their PMF.
Let’s rewind back to the early days of Airbnb. They struggled to gain traction and faced skepticism from investors and users alike until sufficient demand and supply could be demonstrated.

The concept of renting out a room or property to strangers was unconventional, and initial growth was slow. However, the founders believed in their vision and persisted in collecting data and iterating on their platform. It wasn't until they gathered more information on user behavior, refined their offerings, and implemented strategic marketing campaigns that they began to see significant traction.
They found from interviews and usage data over time that travelers enjoyed professional photos of listings, so they hired photographers to help take wonderful photos for hosts who lacked the expertise. Airbnb also found ways to generate demand via guerilla marketing campaigns, offering hosts tools (aka. bots) that reposted listings onto Craigslist to increase exposure. These activities were not possible without data, observations, and constant testing and learning.
High Variance In Customer Acquisition Cost (CAC)
Investing in customer acquisition, particularly for enterprise or up-market segments, adds another layer of complexity to measuring product-market fit. It becomes challenging to distinguish between genuine product-market fit and a situation where customers are acquired at highly varying low and high cost due to marketing efforts, sales incentives, or simply when you have long sales cycles due to the industry you operate in.
While you may be able to ‘average out’ the costs over time, frequent significant outliers in sales lead time per deal and customer acquisition costs may signal you haven’t quite nailed your distribution or channel strategy for your product.
Take for example, my time in Littlepay, both a B2B and B2G payments company during the earlier phases of its life stage:
Prospects with long sales lead times due to incumbent vendor contracts being between 5 to 10 years long
50% of prospects required responding to tenders released, ranging from Request For Interest through to Request For Proposals
80% of deals closed within 15 weeks of prospecting to signature
20% of deals closed within 18 months of prospecting to signature
However, the longer 18 month deals resulted in 90% of revenue for the company, when signed.
Would you say that the company found product market fit?
Some may say yes. Some may say no.
It gets even more complicated when you start to measure other metrics. Let’s investigate Littlepay in a short case study below ⬇️ 🚆.
Case Study: Our PMF Challenges at Littlepay
My time at Littlepay provided me the biggest lessons in understanding what product market fit could look like for an early stage business. I would say that the first-third of my tenure at the company was spent solving for product market fit, before scaling it globally through APIs and indirect go-to-market channels.
As employee number 7, with barely a product in existence at time of joining, we had many different directions we could take. Luckily, we had a strategic merchant we worked with closely to refine our minimum viable product and our product roadmap for iterations to come later on.

Across my 5 years in the startup growing from zero to nearly 100 million transactions per annum, I recall three distinct events with strong positive signals, but also extremely mixed signals too:
Transaction Throughput:
Positive Signal: we grew our platform to process millions of transactions for one strategic partner’s many sub-merchants. Win!
Mixed signal: many millions of transactions processed, but only through one strategic merchant that bought into our solution from day zero. We needed to diversify our client portfolio.
Market Penetration:
Positive Signal: analysing the market, we calculated that we were processing transactions for 50% of the UK Private Bus Operator market, measured by fleet size in number of buses and converted 3 out of the 5 ‘Big 5’ operators. Big win!
Mixed signal: we could only convert transit operator deals during the first couple of years. By year three, we had not won a major tender issued by a public transit authority outside the UK, funded by a government. Luckily, we started to win the year after though!
Portfolio of Integrated Re-sellers:
Positive Signal: we successfully managed the integrations and certifications of 12 partners to our API-based platform, either fare validator hardware vendors, or integrators. Another win!
Mixed signal: while a large majority of these were integrated, almost 80% of our revenue came from our first strategic fare validator partner in the UK, not from the newly integrated ones. It took a long time to realise the benefits of the partners as we provided sales enablement and realised how to best partner and pitch in global tenders.
By the end of my time at Littlepay, I would classify that we reached product market fit for the UK Bus Industry, but for the public transit authority industry, we failed to gain the true product market fit, as we saw only a third of our revenues generated by non-UK partners.
Fast forward to now: I can see from its website that the company has achieved many international deployments via tenders, with strong evidence that it has high product market fit as a global payments player for all transit organisations, from small to large, from public sector to private.
Six Signals Suggesting Strong Product Market Fit
OK. So we sort of know what product market fit is about. However, how can you tell if you've achieved this nirvana state?
From customer satisfaction metrics to traction indicators, there are several key signals to look out for. For the remainder of this post, we'll delve into Six core signals that indicate your product is hitting the mark with your target audience.


